HomepageBill paymentsLogin
01 · Data
Customers were going round in circles.
The journey data showed a loop: homepage, bill payments, login, and back to the homepage.
ContentSquareGoogle Analytics
We started as three new designers nobody listened to. Step by step we became the team that backs design with data, and I set up the framework behind each step.
We came straight from college, eager to make things. We did our best work for about a year, but barely anyone listened, and anything new was hard to get approved.
My boss saw the value in what we were saying and proposed a team that backs every design decision with data. I set up what that team would run on: the frameworks and processes for how data reaches design, and how our libraries get made. My boss took it to leadership.
every digital interaction a customer has with our website and apps, and the impression they walk away with.
"Customer-centric view > technology. Customer behaviour > strategy."
Our first plan for DCX
Google Analytics was already in the company, but not in designers' hands. I opened it to them, with a process for using it. Then we added ContentSquare, which is built for design: clicks, misclicks, how people actually move through a page. Medallia and voice-of-customer surveys added what people said: 47,172 responses in January 2023 alone.
Dashboards like DCX Metrics let a designer check a page before redesigning it, and a product owner check it after.
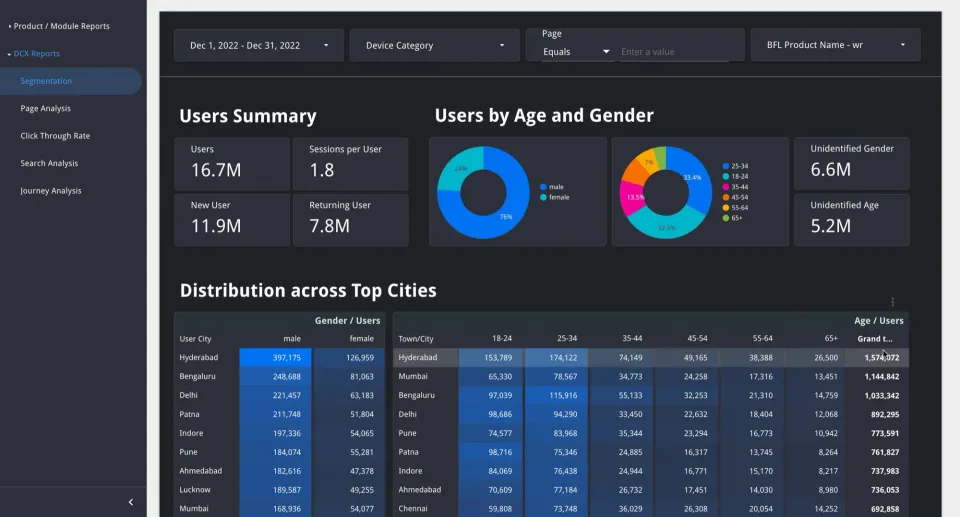
Numbers alone don't change a design. I wrote a framework for reading them: audit the journey, analyse the data, benchmark, and only then redesign and test. Our proposals started getting approved, because each one came with its reason.
I brought in Adobe Target, showed the business what it could do, and set up the system and its rules: what can be tested, on how much traffic, and how every result reports back to CleverTap and Google Analytics. Then we taught the product teams to propose their own tests: a problem, the data behind it, a hypothesis, one variant.
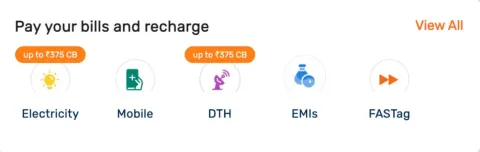
What the data showed: people looping homepage → bill payments → login.
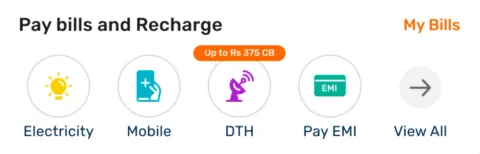
The experiment: give them "My Bills" directly. "View all" still goes to bill payments.
A/B tests say which version wins, not why. Once the numbers had earned us a hearing, we added qualitative research: we hired researchers, brought in agencies, and set the rules they'd work by. I wrote our rules for remote usability testing, from goals and recruitment to the agency brief, and the UX audit checklist.
Live tests can't try what isn't built. So we built a replica: a progressive web app (a website that installs and behaves like an app) that looks like the real site, wired to the same analytics, tested by a panel matched to real customer profiles. Surveys and moderated tests that used to take a month came back in a week.
Live A/B tests on the real site, and rapid prototypes in a replica that risks nothing.
Realness. Panel users match real customers but aren't them; prototypes ran on mobile only, and only the tested path worked.
A live test needs real traffic and weeks, and can't try new form steps or anything unbuilt. A prototype tells us why, not just which.
No change shipped on taste. Each one was tied to a number the business already cared about: task success up on this page, so the funnel improves by this much. That kept us moving, and earned us room to do more.
Design got a number of its own: DXS, a 0–10 digital experience score, with a target for every product.
Every framework was written down so anyone on the team could run it. Tools got the same treatment: I mapped our tools phase by phase, scored 17 documentation tools and picked FigJam for almost everything, because it came with the Figma licences we already paid for. Notion sat beside it, and XMind handled information architecture (IA): how the pages are grouped and linked.
please please please!!!!!!
In the FY24 plan for the consumer web business, "Own the experience" sits beside 450 million in traffic and ₹14,000 crore (₹140 billion) in business. Design was no longer asking for a seat. It had a number to hit, like everyone else in the room.
A real experiment on the bill-payments card, from the data that started it to the template it left behind.
The journey data showed a loop: homepage, bill payments, login, and back to the homepage.
The insight framework asks three things: what we saw, why it happens, and the one change that should fix it.
A · Control
B · Variant
"My Bills" takes people to log in and see their bills. "View all" moves into the row and still opens bill payments.
Live traffic
Adobe Target split a slice of real visitors between A and B. Every click reported back to the analytics we already trusted.
The number it answers to
If B wins
Each test is judged on a success metric and its revenue impact. Only a winner goes live for everyone.
Every team now proposes the same way: the problem, the data behind it, a hypothesis, and a Figma file that passes the handoff checks above. The next change starts back at data.
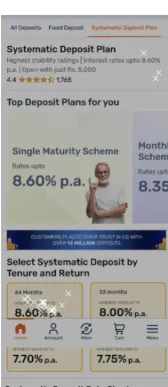
A 50-person study of the deposit pages, run without a moderator: 81.6% task success and click heatmaps on the participants' own phones.
Six checkpoints from content review to post-build QA, with a shared defect log that marks whether an issue is a repeat.
Practice · QAThe first design-library build and the team's Figma licences both went into the FY22 design budget. That story continues in Bajaj Design Library.
FY22 budgetAwarded for "Data Analysis for Design".
Sep 2023